

Core Web Vitals are three metrics Google uses to measure the real experience of people visiting your website: how long it takes for the important stuff to appear, how fast it responds to a click and whether the content moves while you read it. You don’t need to be technical to understand or improve them, but you do need to know what they are, where to look at them and which changes have the most effect. This guide explains what to measure and how to improve your LCP, INP and CLS with concrete examples for WordPress.
Quick summary
- LCP (main content loading): good up to 2.5 seconds. INP (response to interaction): up to 200 ms. CLS (visual stability): up to 0.1.
- According to the Web Almanac 2025, only 48% of sites pass all three on mobile (56% on desktop).
- On mobile, LCP is the metric most websites fail: it’s almost always fixed with images and scripts.
- Measure with real (field) data, not just lab tests.
In this article
What LCP, INP and CLS are
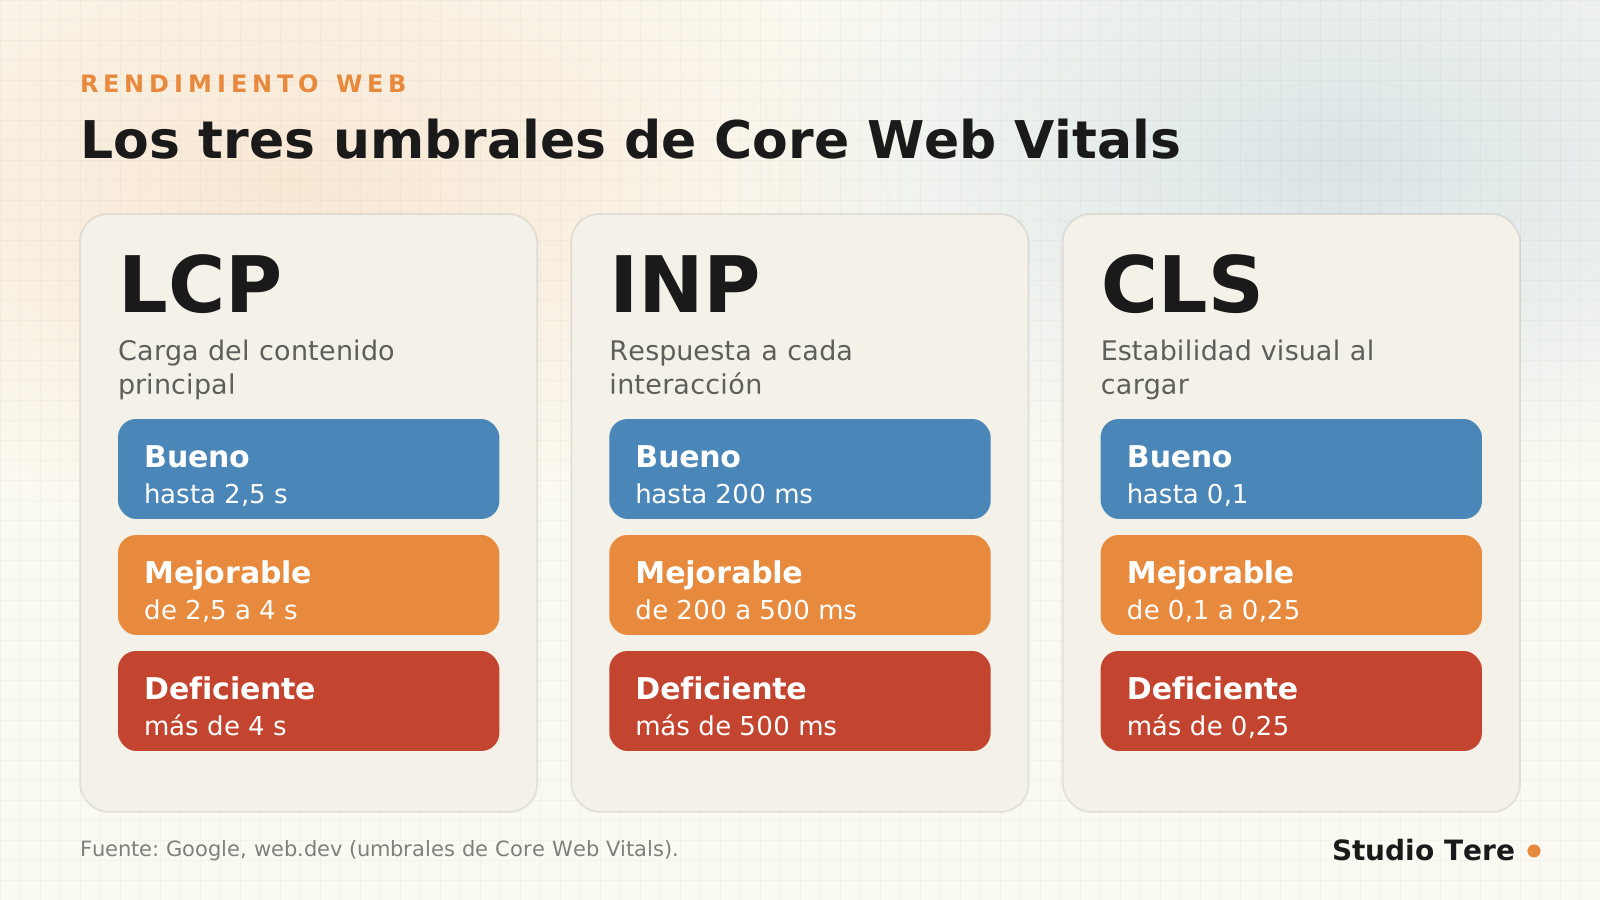
- LCP (Largest Contentful Paint): the time until the largest element on the screen appears, usually a main image or a headline. It’s the feeling of “it has loaded.”
- INP (Interaction to Next Paint): how long the page takes to react visually after a click, a tap or a keystroke. It replaced FID as the official interactivity metric.
- CLS (Cumulative Layout Shift): how much the layout shifts while loading. It’s that annoyance of going to press a button and it moving right before.
Google defines the thresholds on web.dev: for each metric, “good” is measured at the 75th percentile of real visits, meaning most of your users have a good experience, not just those with the best connection.
The state of the web today: the Web Almanac 2025
HTTP Archive’s Web Almanac 2025, with real Chrome data from July 2025, shows that we’re improving little by little, but there’s a way to go:
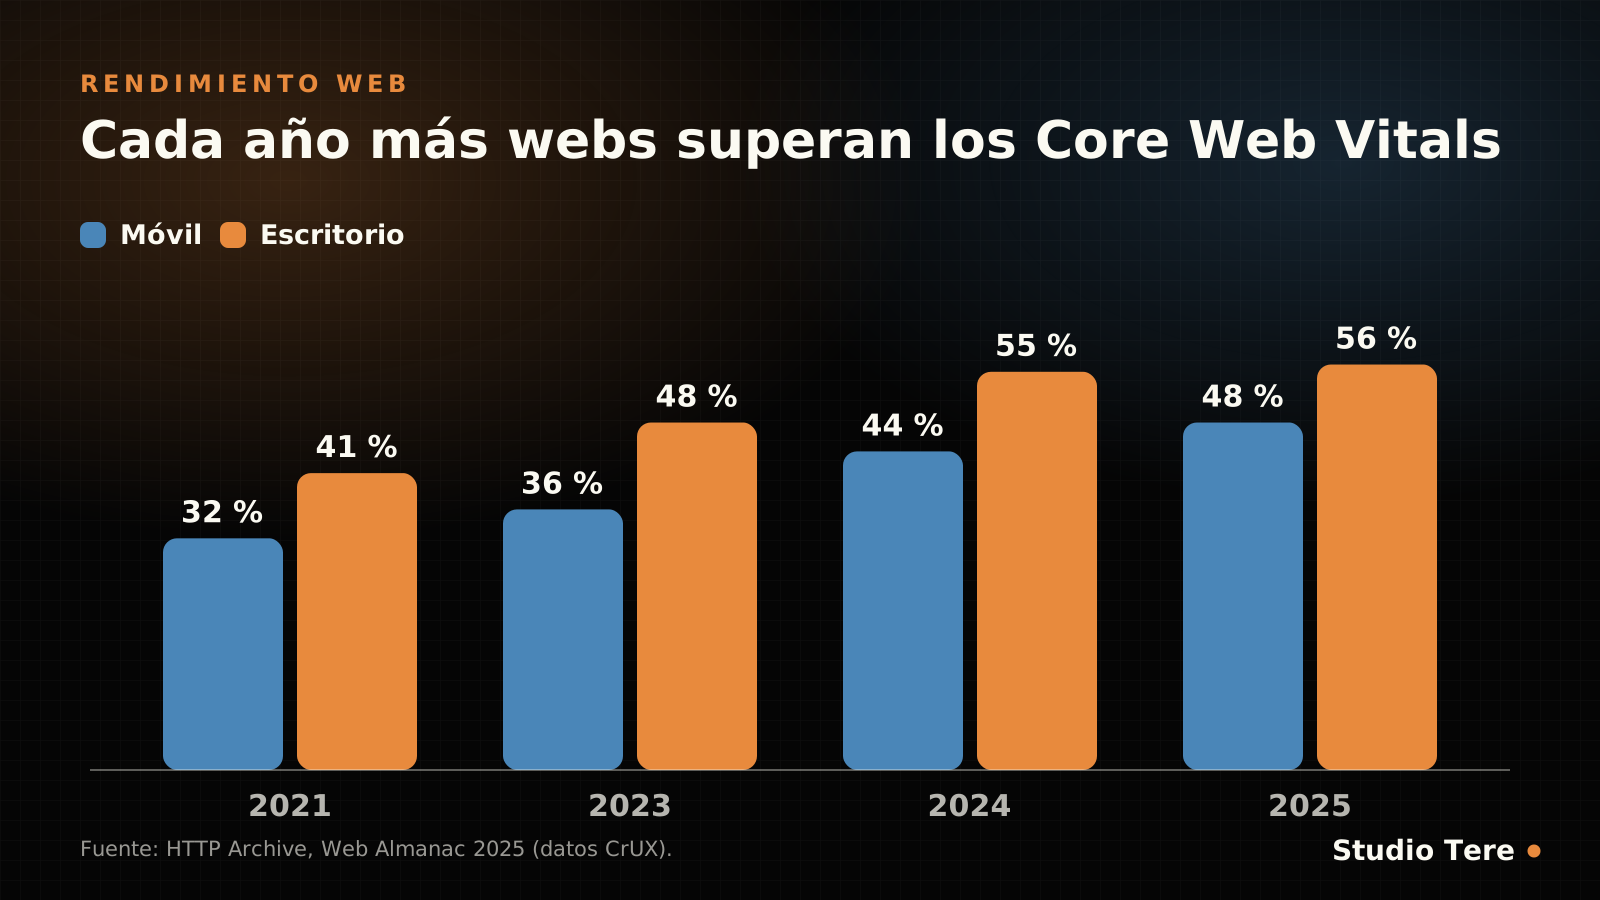
- 48% of sites pass all three on mobile and 56% on desktop.
- On mobile, 62% have a good LCP, 77% a good INP and 81% a good CLS: LCP is the bottleneck.
- The improvement is steady: the mobile pass rate is up from 32% in 2021.
And speed isn’t just a technical matter. A 2017 Google study (Google/SOASTA) calculated that 53% of mobile visits are abandoned if the page takes more than three seconds to load. It’s an old figure, but the behavior it describes hasn’t changed.

How to measure them without fooling yourself
There are two types of data and it’s best not to mix them:
- Field data: measurements from real users (Chrome report, Search Console). These are the ones that count for Google.
- Lab data: simulated tests (Lighthouse, PageSpeed Insights). Useful for debugging, but they don’t reflect all your users.
Start with PageSpeed Insights (it shows field data if your site has enough traffic and, below, the lab diagnosis) and with the Core Web Vitals report in Search Console, which groups your URLs into good, needs improvement and poor. If you want to measure on your own site, the web-vitals library does it in a few lines:
import {onLCP, onINP, onCLS} from "web-vitals";

onLCP(console.log);
onINP(console.log);
onCLS(console.log);
Improving LCP: what has the most impact
First identify which element is the LCP (PageSpeed Insights points it out). On the vast majority of sites it’s the main image or the headline at the top. Then, in order of impact:
- Optimize the main image: correct dimensions, compression and modern formats such as WebP or AVIF, with
srcsetso mobile doesn’t download the desktop version. - Don’t lazy-load the LCP image.
loading=~lazy~is for what’s off-screen, not for the first thing you see. - Give it priority. The
fetchpriority=~high~attribute tells the browser that image is important. - Reduce server wait time: good hosting, page caching, a supported PHP version and a database without junk.
- Remove what blocks rendering: CSS and JavaScript that delay the first paint.
- Load fonts carefully: few variants,
font-display: swapand, if possible, hosted on your own server.
An example of how to prioritize the main image with one line in the header:
<link rel="preload" as="image" href="/imagenes/hero.avif" fetchpriority="high">If you want to go deeper, web.dev’s Optimize Largest Contentful Paint guide breaks LCP into four phases and explains where time is lost in each.
Improving INP: less JavaScript, shorter tasks
A bad INP almost always means the browser’s main thread is busy running JavaScript when the user tries to do something. The levers are:
- Fewer third-party scripts: chat widgets, maps, analytics and pixels add a lot of work. Load only the essential ones and defer the rest.
- Break up long tasks (over 50 ms) into chunks so the browser can respond in between.
- Keep event handlers light: have them do the minimum and delegate the rest.
- Avoid forcing layout recalculations by alternately reading and writing DOM measurements.
async function procesarEnTrozos(elementos) {
  for (const elemento of elementos) {
    hacerTrabajo(elemento);
    // Cede el control para que el navegador pueda responder
    await new Promise((resolver) => setTimeout(resolver, 0));
  }
}
On mobile, INP is the most demanding (77% good scores, versus 97% on desktop, according to the Web Almanac), because devices have less power to process JavaScript.
Improving CLS: reserve the space
Layout shifts almost always have a simple cause: the browser doesn’t know how much space something will take until it loads. The solution is to tell it beforehand:
- Set width and height (or
aspect-ratio) on images, videos and embeds. - Reserve space for banners, ads, cookie notices and forms that appear later.
- Don’t insert content above what the user is already reading.
- Take care with fonts: a fallback font with similar metrics prevents the text from reflowing when the final one loads.
- Animate with transforms (
transform,opacity), not by changing dimensions.
How to apply it in WordPress
- Hosting and caching: a fast server with page caching makes the difference in LCP.
- Images: resize before uploading, use modern formats and avoid serving huge images in small containers.
- Plugins: each one can add CSS and JavaScript. Remove the ones you don’t use and check which ones load on every page.
- Theme and builder: clean markup and fewer layers help, although they weigh less than images and scripts. We analyze it in Etch vs. Gutenberg.
- Fonts: host your own, limit variants and preload the main one.
- Third-party scripts: measure their cost before adding them and load them deferred.
How much do they matter for SEO and for business?
Google includes Core Web Vitals among its page experience signals, but it is clear on one point: a good page experience doesn’t make up for content that doesn’t answer what people are searching for. Think of them as a tiebreaker and, above all, as an improvement for your visitors: a fast, stable website converts better. If your priority is ranking, start with a good technical foundation, which we review in the technical SEO checklist and in our technical SEO and ranking service.
30-day plan to improve your Core Web Vitals
| Week | What to do | Expected result |
|---|---|---|
| 1 | Measure: PageSpeed Insights and Search Console; note the poor URLs | A clear starting point |
| 2 | Images: LCP, formats, sizes, lazy loading only off-screen | Better LCP |
| 3 | Scripts: remove unnecessary plugins and third parties; defer the rest | Better INP and less weight |
| 4 | CLS and fonts: dimensions, reserved space, preloading the main font | Stable layout |
| Afterwards | Measure again with field data (it takes a few weeks to show) | Confirm the real improvement |
Frequently asked questions
Why does PageSpeed give me a good score and Search Console flags errors?
Because they measure different things: PageSpeed shows a lab test and, separately, field data; Search Console uses only real user data from the last 28 days. Field data is what counts for Google.
What is INP and why did it replace FID?
INP measures the response of all interactions during the visit, not just the first, so it better reflects the real experience. That’s why Google adopted it as the official interactivity metric.
Do I need a 100 score on PageSpeed?
No. The score is a lab summary. What matters is passing all three metrics with real data and the website feeling fast.
Does my hosting matter?
A lot for LCP, because server response time is the starting point of loading. Slow hosting limits any later optimization.
How long does it take for the data to improve in Search Console?
A few weeks: the report is calculated with the last 28 days of real visits.
Want us to measure your website and tell you what to fix first?
We review performance, indexing and structure, and deliver a prioritized plan, with no promises of impossible rankings.